
Frequently Asked Questions
Our Cyclone Center talk page is a great resource for users to engage in discussion about particular images, as well as get some feedback from moderators and the science team. If you haven’t seen it yet, we suggest checking it out!
Since our launch, we have received a lot of feedback and questions about the project, through members posting on our talk page, as well as comments on this blog. Thank you very much and keep them coming! We have put together a FAQ that we hope will answer many of your burning questions:
FAQ’s:
How do I pick the right match?
Focus on the shapes of the clouds and their colors. Size and orientation don’t really matter. The key is remembering that tighter spirals and colder colors are signs of stronger storms. It’s a little subjective, and that’s why we’re doing this. Your opinion matters, so give us your best guess.
If it’s subjective, then what’s the point?
When two opinions about a storm are different, we need to determine which one is best. Cyclone Center has up to 30 volunteers look at each image, and then we’ll combine them statistically. This approach has worked well in other citizen science projects. It’s never been tried with tropical cyclones before, but we are confident that your classifications will help us learn more about these storms.
Hasn’t an expert already looked at these storms?
Yes, but the methods have changed over time and between regions. We have nearly 300,000 satellite images of tropical cyclones for the last 32 years from around the world. You’re helping us classify all of them with one method. You’re also providing us with valuable new information about the shape of the storm, like whether or not it had an eye. It would take a team of experts years to finish this task, so we’re relying on you to help us do it much faster.
Can a regular person like me really help?
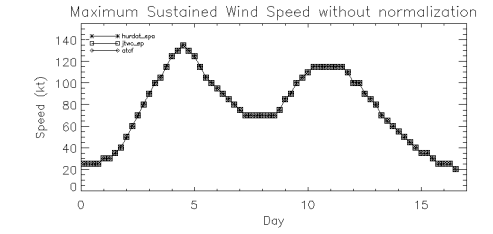
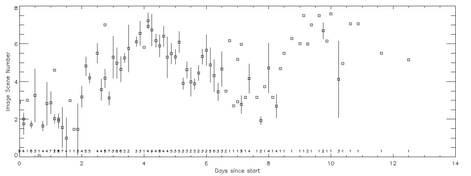
Yes!! We even have some preliminary data that tells us how great you’re all doing. The two graphs here show the current estimate of intensity for a particular storm (top), and the estimate that we’ve gotten from your classifications (bottom). We are just starting this project, so there is more analysis to be done. But it’s clear that your classifications are matching what we expected! You can find more information on our blog here.
What’s a Cyclone?
The dictionary says a cyclone is a storm that rotates around a center of low atmospheric pressure. That can include tornadoes, winter storms, and the “tropical cyclones” that we’re looking at here. Tropical cyclones are organized systems of thunderstorms that get their energy from warm tropical oceans. They’re often called Hurricanes in the Western Hemisphere, Typhoons in the western North Pacific, or just Cyclones in the rest of the world, but they all mean the same thing.
This doesn’t look like a hurricane. Where’s the eye?
When you think of tropical cyclones, you probably picture the classic circular storm with a clear eye in the middle. However, eyes only happen in stronger storms, like the ones that make the news. We think about 15% of our images will have those picturesque eyes. Most of the others will be less organized and harder to classify. In fact, because they’re more difficult, those weaker ones are where we need the most help and you can make the biggest difference!
Are there only these six images for this storm?
Probably not. Because the images are collected every three hours, and most storms last several days, a storm may have several hundred images that cover its whole life. In fact, Tropical Cyclone Hondo lasted nearly all of February 2008 and has over 600 images!
You are seeing six images taken from some period within the storm’s life. So in most cases, you’ll see a portion of the storm’s life cycle, but not the entire thing.
What do I pick when it doesn’t look like anything?
If it looks like there is no organized storm in the image, try looking through the curved band options. Curved bands are generally the weakest of the storm types, and often appear very disorganized. However, from time to time there is an error in the satellite location, and there might truly be nothing in the image. If that’s the case, choose “No Storm” under the “Other” option.
I made a mistake! How do I go back?!
If you’ve already finished the image, don’t worry! There’s more than one way to classify most of these images. By averaging all your answers together, we’ll still get a pretty good estimate.
If you haven’t completed the classification, you can always go back to the beginning and start that image over. In the bottom right corner, next to the Detailed Classification checkbox, you should see a small orange arrow. Clicking it will take you back to the beginning of that image.

I found a neat storm. Can I talk about it or save it for later?
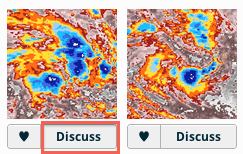
After you’ve finished a set of images, you’ll be shown all 6 of them side by side, and each one will have a “Discuss” button beneath it. Simply click on that button, and you’ll be taken to our Talk page, where you can post your comments about that image.
Alternatively, you can always go to talk.cyclonecenter.org and see what other people are discussing, or start your own conversation about anything that interests you!
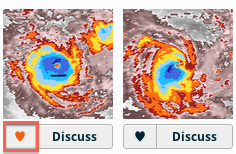
If you’d like to save an image for later, just click the heart next to the “Discuss” button, and the image will be saved to your favorites.
To get to your favorite images, click the “Profile” button at the top of the page. You’ll be shown how many images you’ve classified, and here is where you will see the list of all of your favorite images. From there, you can quickly get to the “Talk” page, where you can discuss that image.

Is there any other way I can help?
Yes! When it comes to citizen science, strength in numbers is our greatest asset, so recruit some friends! You can like us on Facebook at facebook.com/cyclonecenter or follow us on Twitter at @CycloneCenter. The more classifications we get, the better the science will be in the end!
How did we pick the images for each cyclone type?
In Cyclone Center, one of your first tasks is to: “Pick the cyclone type, then choose the closest match.” You may be wondering how we found the images that you’re matching against.

One of the first steps in the Dvorak technique is to determine the storm’s “Pattern” strength. It’s an initial estimate of the storm’s strength based on how the clouds are organized. Here are Dvorak’s original patterns:

Each of these patterns gets stronger as we move from left to right, similar to in Cyclone Center. We could have used these patterns in Cyclone Center. However, the strengths are irregularly spaced, and there are only two levels of strength for Eye storms. We chose instead to use real satellite images to identify each pattern.
Some of the most highly trained Dvorak analysts in the world work in the Tropical Analysis and Forecast Branch (TAFB) at the National Hurricane Center. To take advantage of this expertise, we sorted the satellite imagery from the Atlantic in 2003–2006 by the strengths and cyclone types that they assigned. We then chose representatives from each category based on these criteria:
- Image quality
- Similarity to the original Dvorak patterns
- Representativeness of that image compared with others of the same strength and cyclone type
- Continuum of strengths for a given cyclone type
The last criteria was particularly important since we wanted to show a clear progression from weakest to strongest in each cyclone type. So if you are ever debating between two images to select, remember that they go from weakest to strongest and see if that helps.
How do I know which storm appears stronger?
When Dvorak developed his method, he knew that you could tell something about a storm’s strength by looking at its lifecycle. If a storm looks stronger than it did yesterday, odds are that it probably is! That’s why the first step of most classifications is to ask which of two images look stronger. These are actually two images of the same storm taken within 24 hours. If the image you see is from the first 24 hours of the storm (or the image 24 hours prior is missing) then you’ll skip this step.
We’ll use your answer to calculate something called the Model Expected strength. It starts with the storm’s strength from 24 hours ago. If you say the newer one looks stronger, then we’ll bump it up a notch. If the older one looks stronger, then we’ll bump it down. And if they’re about the same, then we just hold it constant. This isn’t as sophisticated as some of the other ways we estimate strength (see the upcoming posts on the Detailed Classifications), but it gives us a good first guess.
A number of characteristics determine whether a storm is stronger, weaker or about the same. There are two main measures of strength to look for:
1. How cold are the clouds?
Colder colors in infrared imagery indicate taller clouds that release more energy into a storm. Stronger tropical cyclones tend to have taller clouds and more of them. For example:
- The presence of more colder colored clouds in an embedded center suggest a stronger storm.
- Colder clouds surrounding an eye suggest a stronger storm.
2. How organized are the clouds?
This question is a bit more subjective, so just give it your best shot. Some features that might indicate which storm image is stronger:
- Stronger storms have spirals that wrap farther around the storm.
- The cold clouds near the center become more circular as a storm strengthens.
- Typically Shear and Curved Band storms are weaker than those with an Embedded Center.
- Storms with an eye are almost always stronger than storms without one.
- For storms with an eye, consider the shape, size and color of the eye. Eyes that are more circular, smaller and/or warmer tend to be associated with stronger tropical cyclones.
In some cases, the storm on the left may appear to have some of these characteristics, while the storm on the right may appear to have others. If this is the case, they can actually cancel out, in which case we would say that they are about the same. For example: If the storm on the left appears better organized and more tightly-wrapped, but the storm on the right has more cold colors, you would say that they are about the same.
You can use the images below to help you gauge a storm’s relative strength.

