Spawns of El Nino? Hurricanes Iselle and Julio Aim For Hawaii
Cyclone Center is tracking two storms as we classify this afternoon.
It has been quite a remarkable week in the eastern and central Pacific that has culminated in two hurricanes taking aim at the Hawaiian Islands today. Hurricane Iselle has shown herself to be quite resilient as she has maintained her hurricane strength despite moving over cooler ocean waters. Hurricane warnings are out for the big island as residents prepare for a significant event. Meanwhile, Hurricane Julio is following close behind, continuing to intensify despite his movement over cooler waters. The graphic below from the Central Pacific Hurricane Center shows the likelihood of significant winds over the next few days in the islands: Read More…
Early results for Charley and Frances
What a week we had! We had envisioned many classifications, but received so many more! So far we have received more than 11,000 classifications from nearly 2000 users in June. These storms had never been analyzed on CycloneCenter and Hurricane Charley was completed on the first day! Hurricane Frances is nearly complete now. We will likely have more completely new storms this month.
Learning algorithms
There are numerous crowdsourced science projects out there and each have the same goal: Read More…
Trouble in Paradise: Hawaii and Tropical Cyclones
Hawaii – a tropical paradise, full of sun, fun, palm trees, beauty, mountains, volcanoes and more. But wait…have you ever thought about Hawaii and tropical cyclones? Although not frequent, tropical cyclones have battered the Hawaiian Islands several times in recent memory.
Do cyclones develop ‘off-season’ in the Atlantic?

Headquarters for the U.S. National Hurricane Center
In the Atlantic, the official dates for the hurricane season are 1 June – 30 November. This certainly doesn’t mean that cyclones only exist during this time frame, yet 97% of all cyclones that have developed have occurred during those months. While we really won’t know exactly how many cyclones have developed out of season prior to 20th century technological advances, there is evidence of off-season storms in the Atlantic dating back to May of 1771, and more recently tropical storm Beryl in May of 2012. Most cyclones that develop out of season do not typically impact the U.S., but there have been more than handful that have, giving us pause to think what a fickle planet our Earth can be.
Where did the tropical cyclones go this season?
In short – the western Pacific.
The Atlantic Basin was predicted by many to have an active season. But the season ended November 30th, and it was a very quiet one. There were 13 named storms in the Atlantic, of which two developed into hurricanes. The Accumulated Cyclone Energy (ACE) Index is used by the National Oceanic and Atmospheric Administration (NOAA) to measure the severity of hurricane seasons. It considers the intensity and the lifespan of storms. The 2013 Atlantic season was well below normal; the ACE index came in at 33, about 31% of the 1981-2010 average of 104.
On the other side of the planet, in comparison to the Atlantic Basin, the western Pacific appears to be the ‘hot spot’ this season for strong tropical cyclones. The western Pacific has seen 31 storms, 13 being typhoons (in this region, hurricanes are called typhoons). This makes the western Pacific season slightly above the 1981-2010 average of 26 named storms. The ACE index for the Western Pacific, however, stands at 268.3 – about 88% of the 1981-2010 average of 302.
Typhoons such as Lekima, Usagi, Fransico and of course Super Typhoon Haiyan(Yolanda) will be recorded in the 2013 history book. A super typhoon is a typhoon whose winds exceed 150 mph, equivalent to a Category 4 or 5 hurricane on the Saffir-Simpson scale.
What has contributed to the strong activity seen in the western Pacific this season? A combination of the right ingredients is the answer. A tropical cyclone needs favorable conditions, such as moisture, warm sea surface temperatures, and lack of wind shear in the upper atmosphere in order to aid development. Based on the activity in the western Pacific, it is likely that those conditions were present much of the season.
The 2013 tropical cyclone season was bittersweet for many; those in the Atlantic were glad for a quiet season while many in the western Pacific were forced to make preparations all season. Our prayers are with those affected by these forces of nature.
Visit Cyclone Center to classify many storms including those past storms that formed in the western Pacific, such as: Supertyphoon Dale (1996), Super Typhoon Herb (1996), Typhoon Faxai (2001), Super Typhoon Mike(1990) and more.
– Davanna G. Saunders is an undergraduate student in Atmospheric Sciences at the University of North Carolina at Asheville. She recently joined the Cyclone Center team as a classifier and contributor to our social media.
Super Typhoon Haiyan Threatens Philippines
Today we urge our Cyclone Center users to pause and send positive thoughts to our friends in the Philippines.
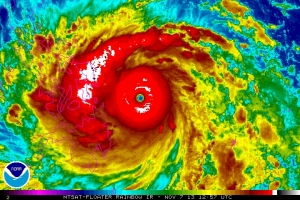
Evacuations are underway as Super Typhoon Haiyan (known as Yolanda in the Philippines) makes its way directly towards the country. Intensifying without restraint since Sunday, Haiyan is now a Super typhoon, which is equivalent to a Category 5 hurricane on the Saffir-Simpson Scale. Haiyan currently has winds near 170 kt (195 mph).
Moving west northwestward, Haiyan is expected to make landfall in the Philippines early Friday morning. Because of the very warm water temperatures along her path, Haiyan is expected to maintain her status as a super typhoon through landfall.
With this super typhoon comes potentially severe damage. Haiyan is likely to bring heavy rainfall, severe flooding, damaging strong winds, and mudslides into very heavily populated areas of the Philippines. The forecasters at the Joint Typhoon Warning Center are encouraging evacuations across the country, especially in the central Philippines, in preparation for the biggest storm of the 2013 season thus far. She is the fifth super typhoon to form this year in the western Pacific.
– Kelly Dobeck is an undergraduate student in Atmospheric Sciences at the University of North Carolina at Asheville. She recently joined the Cyclone Center team as a classifier and contributor to our social media.
Hurricane Katrina and the Intensifying Coastal Threat
This week Cyclone Center introduces Hurricane Katrina (2005) as one of our featured storms. This is the 8th anniversary of Katrina’s assault on the northern Gulf of Mexico coast. The city of New Orleans, despite a massive system of protective levees and pumps, lost over 1500 souls, almost all from drowning when water flooded about 80% of the city. Since then, millions of dollars have been spent on the repair and upgrade of the levee system in and around metro New Orleans. Are they ready for the next one?
“We’ll be absolutely ready for it,” said U.S. Army Corps communications officer Wade Habshey in a recent Discovery News article. “What we have in place now can withstand a Katrina-level storm.”

New Orleans flooding caused by 60 kt. winds, 10-14 ft. storm surge. Category-5 values: 140 kt winds, 25-35 ft. storm surge.
But what exactly is a “Katrina-level” storm? Winds in downtown New Orleans rarely exceeded minimal hurricane force at the peak of the event. Storm surge and the strongest winds from the weakening Katrina were focused well to the east in coastal Mississippi. And yet levees failed, water flooded significant portions of the city, and over 1,500 perished.
An even bigger concern in the long-term are geological changes occurring in the area; coastal portions of Louisiana are sinking into the ocean as climate-forced sea levels continue to rise and land areas sink. This exacerbates the threat of hurricanes for a region that experiences one on average every couple of years. Many climate scientists now believe that hurricanes will be stronger on average in the future as the ocean, which provides the fuel for the storms, continues to warm.
What more should be done? Government officials exude confidence that the improvements to the levy system will hold up, but we’ve heard that story before. Claims were made soon after Katrina that the levee system was designed to withstand a Category-3 storm , not something like “Katrina’s strength”. We’ve already seen that Katrina wasn’t even a hurricane in New Orleans – what happens when a real Category-4 or 5 storm hits the area? We can only hope that residents will have left, because it’s a very good bet that there will be little dry land to stand on.
– Chris Hennon is part of the Cyclone Center Science Team and Associate Professor of Atmospheric Sciences at the University of North Carolina at Asheville
New Developments on Tropical Cyclones and Climate Change
One of the goals of the Cyclone Center project is provide a more definitive answer on how tropical cyclones (TCs) have been responding to the dramatic changes that our climate is undergoing. It is difficult for meteorologists to determine how strong tropical cyclones are getting because we rarely observe them directly, relying primarily on satellite data to give us a decent estimate of the wind speeds. But as you can imagine, it is very hard to determine the maximum winds in a hurricane when you are in the hurricane itself, let alone flying more than 22,000 miles above it! Our record of tropical cyclones is by no means nailed down. Read More…
Seasonal Tropical Cyclone Forecasts Are Coming In – But Are They Worth It?
Citizen scientists working on Cyclone Center are working with a few thousand tropical cyclones which have developed since 1978. Beginning just a few years later, Dr. Bill Gray at Colorado State University (CSU) first began issuing forecasts for the number of tropical cyclones that will develop in the Atlantic Ocean for the upcoming Atlantic season (June 1 – November 30 each year). Since that time, several other groups, including the U.S. National Oceanic and Atmospheric Administration (NOAA), have also developed similar techniques to predict seasonal activity. With the official start of the Atlantic season just a couple of weeks away, this year’s predictions are in.

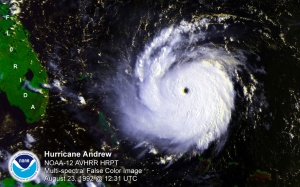
Hurricane Andrew, a devastating Category-5 storm, occurred during an extremely quiet Atlantic hurricane season.
The CSU forecast, issued in April of this year, predicts 18 named storms (those achieving at least Tropical Storm strength), 9 hurricanes, and 4 major hurricanes (Saffir-Simpson Category 3 or higher). This is well above the long-term average for the Atlantic. The NOAA forecast, which relies on similar parameters to predict activity (e.g. warm ocean temperatures, El Nino phase), puts the chances of an active season at 70%. Groups in other parts of the world also produce seasonal forecasts for their own region. For example, the Bureau of Meteorology in Australia issues a national as well as regional seasonal outlooks. Recently, other groups such as the United Kingdom Met Office have begun issuing “dynamical” forecasts, which explicitly count tropical cyclone-like features in weather models rather than relating environmental conditions to past activity.
Seasonal forecasts receive quite a bit of publicity, despite questions about their skill and usefulness. Statistical schemes such as the CSU forecast, rely on past connections between environmental factors and TC activity. They fail especially in predicting extreme seasons, such as the 1995 or 2005 Atlantic seasons, because the models just don’t know about hyperactive years like that. Dynamical predictions, which theoretically can predict record breaking years since they do not rely on past seasons, have been shown to have better predictive skill than statistical techniques for seasonal TC prediction.
But even if a model were 100% accurate, would it really make a difference? The majority of systems that do develop into tropical cyclones do not affect land. Predictions of landfall are made by several groups but have not shown any skill so far. For any given location of coastline, the chances of a TC impact in any given year are very small. So if a homeowner hears that the upcoming season will be active, should any action be taken? Does it really matter if we’re going to get 12 storms this year or 11? Remember that some of the most devastating hurricane events in U.S. history, such as Andrew in 1992,, occurred during inactive seasons. In the end, how do seasonal forecasts help society?
One could argue that any publicity that gets people to assess their readiness is good – but I think that most will not do anything. Perhaps more effort should be invested in determining how the nature of tropical cyclones will change in our warming world. Cyclone Center is going to provide researchers with new data that will help determine if and by how much the nature of global tropical cyclone activity has been recently changing. With stronger tropical cyclones predicted in the Atlantic and other parts of the world – along with rising sea levels – time and energy is better spent developing plans for mitigation for the big ones rather than issuing forecasts with little or no value for coastal residents.
– Chris Hennon is part of the Cyclone Center Science Team and Associate Professor of Atmospheric Sciences at the University of North Carolina at Asheville
A tale of two storms
The mystical nature of tropical cyclones is that they even form at all. They begin as convective cells (what could be called large thunderstorms). What appears to be a disorganized grouping of storm cells, can organize, begin spinning and in no time, appear to be a fully organized system. Of course there are very technical descriptions as to how this occurs, but from satellite imagery, it can be amazing to watch. While some of the larger convective (colder) cells can appear to be a separate system, they often are actually part of the original circulation. Here are a couple examples recently brought up on the talk forum at talk.cyclonecenter.org, both of which had two significant landfalls.
1989 Typhoon Gay
This system was interesting in that it is a system that began in the Gulf of Thailand – considered the Pacific Ocean – then moved west into the Indian Ocean, eventually making landfall in India as – potentially – a very strong cyclone. Of course I must qualify that statement because of the differences in the best track data. The graph at right shows the best estimates of the storm’s intensity, in maximum sustained wind speed. The system gained strength near day 2, then crossed into the Bay of Bengal and regained strength. At landfall in India, it was likely between 70 and 150 knots, kind of a large range. Some of these differences in intensity are due to the data available to each agency. Another could be in the interpretati0n of the imagery.
A recent talk post from ibclc2 noted the features in Typhoon Gay during its development in the Gulf of Thailand. The organization of the system is beginning to take shape. The convective cell near B is close to a banding feature (if you were doing a detailed classification). But it is not, since the region between it and the central part of the system is not warm enough (it needs to be red or warmer, see the field guide for more information). The portion near A appears to be an embedded center. But upon further review, there appears a warm spot just north of the darkest blue colors. It could be the beginnings of an eye, but only time will tell … and it does. In the next few images, that small warm spot becomes an eye just prior to making landfall on the Kra Isthmus. So how would you classify it? Well it’s likely best left as an embedded center with no banding. While there is the hint of an eye, the primary characteristics of an eye (cold cloud surrounding a warm center in a circular fashion) aren’t complete yet.
2005 Hurricane Dennis
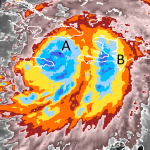
An image of Dennis recently noted by bretarn showed a large system. Similar to Gay above, the satellite image showed a cold center (A) with a large cold band to the east. The convection near A is showing some circulation, so the center is somewhere below that cold cloud cover. So it is an embedded center. Like the Typhoon above, this is an image just prior to an eye emerging. The next question is what to do with B. It is definitely associated with the system, because it appears to be wrapping around the circulation center near A. The region between A and B is warm, with the warmest color being red. So for a detailed classification, this might be considered a banding feature.
In its own right, Dennis was a very severe system, making landfall in Cuba and in the Gulf on the Florida panhandle. However, its fast movement lessened the impact. It is also less memorable because its Gulf landfall was eclipsed by Hurricane Katrina later in the season. Nonetheless, the name was retired from the North Atlantic hurricane names after the season.


