
The Destruction of Kirk
Tropical Storm Kirk would normally be a good candidate this time of year to intensify into a hurricane and threaten the Caribbean, Mexico, and the United States. However, this morning’s Infrared satellite loop shows a storm on the verge of dying:

Here, the colors indicate cold clouds (convection) and the light gray colors indicate warm, low-level clouds. Notice the rotating feature of low clouds near the middle of the image emerging from the convection and moving toward the west-northwest – that’s the low-level center of Kirk.

This is what is called a “sheared” tropical cyclone. The upper level winds in this area are blowing from a different direction and at a much higher velocity than the winds near the surface. This situation has effectively chopped the storm up vertically. This is bad for tropical cyclones because the energy that they need to survive is released in the giant convective clouds (thunderstorms). If this energy is displaced away from the circulation center, the storm will weaken. Kirk is about to become an ordinary open wave.
Sheared tropical cyclones are not always easy to see on satellite imagery. Here are a couple of other pages you can look through to see other examples and learn how to classify them on Cyclone Center:
Joaquin: Classifying Shear Storms in Cyclone Center
Examples of typical scene types
-Chris
– Chris Hennon is part of the Cyclone Center Science Team and Professor of Atmospheric Sciences at the University of North Carolina at Asheville
How do I get started on CycloneCenter?
Images on CycloneCenter may seem overwhelming at first. To help you out, we have tutorials, an overview of the imagery,and plenty of descriptive help with each question when classifying (just scroll down when making a classification).
Also, be sure and log into (or create an account on) cyclonecenter.org. This helps in so many ways. It makes sure each of your sessions is counted as you. It helps us understand you better. Each citizen scientist has different tendencies when answering questions and knowing your selections better helps us find consensus amongst the thousands of scientists already providing input. So please log in.
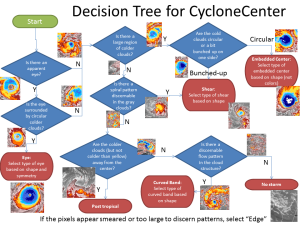
But when it comes to the questions, however, I tend to like flowcharts and while I was answering a question on the talk forum a while back, I came up with a decision tree that might help you out.
 Warning: Read More…
